
For years, we’ve been proud to provide and post local market data charts for our American clients whose subscriptions include content. However, as social media content has progressed, we realized we need to take steps to make this market data more digestible for the average consumer and a bit more visually engaging.
Today, we’re happy to present our new local market data content. The same great, local information that proves your community expertise now looks like you have a professional designer on your team as well! When it comes to great social media content, Back At You has your back.
Below, you’ll see the previous market data content followed by the brand new version. You’ll begin seeing this new content in your Content Calendar when your next monthly batch of content is scheduled.
Previous Market Data Content:

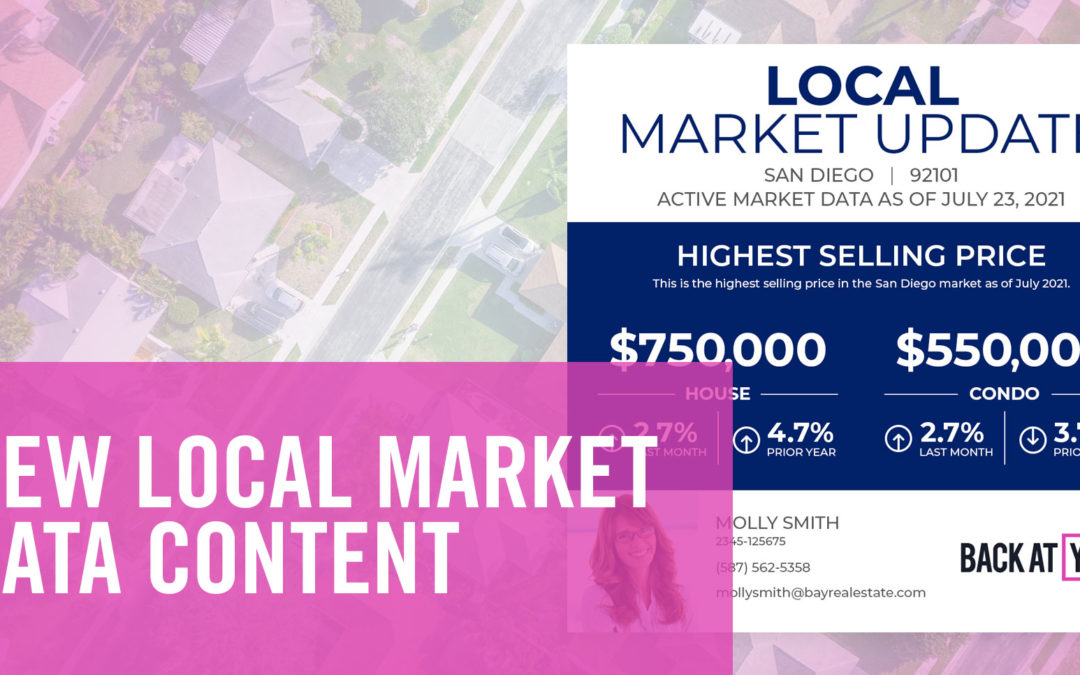
New Market Data Content:

As you can see, our new “Local Market Updates” are much more streamlined. They feature your company branding (colors and logo), contact info, and profile picture. Rather than displaying 12 months of data, we now show the current metric, how it compares to last month, and how it compares to last year. Lastly, in order to ensure maximum accuracy, our system will update the data within these graphics 24 hours before they’re posted on your social media profiles.
We’ll continue on our mission to continually update and improve the content that we create and share for you! As always, your feedback is greatly appreciated.
If you’d like to learn more about how Back At You can help you succeed on social media or if you’d like to add content to your current Back At You subscription, you can reach us at hey@backatyou.com.